All Landsat data are available to the public at no cost from a U.S. Geological Survey website, the Global Visualization Viewer (GloVIS): http://glovis.usgs.gov
WRS-2: Worldwide Reference System (WRS) refers to the global notation for Landsat data. See “path/row” below.
Path/Row: As the spacecraft moves along its path, the sensor scans the terrain below. A grid system of paths and rows (the WRS) is used to provide a reference number for each scene.
Lat/Long: Each path and row grid can be identified by its latitude and longitude, as well as by its path and row.
Max Cloud: You can choose what percentage of a scene you are willing to have covered by clouds. (Landsat sensors do not see through clouds.) If you choose “30%,” the GloVIS search function will show you only scenes with 30% or less cloud coverage.
Scene Information: Example: LT50140342010128EDC00
the third character in each ID tells you which satellite acquired the scene. In this case, “LT5 indicates that the scene was acquired by the Landsat 5 satellite (not Landsat 4, or 7).
(The letters T and E indicate the sensor; please see “Sensor” below.)
CC: Cloud cover. 15% means clouds cover 15 % of the scene.
Landsat sensors cannot see through clouds. The closer to 0% this is, the better.
Date: This is the date when the scene was acquired: year/month/day – So in the case of the example number, 2010 is the year; 12 is the month (December); and 8 is the day.
Qlty: 9: Quality ranges from 0-9 with 9 being the best.
Sensor: This information tells you what instrument on the satellite acquired the image. If it says "TM" it refers to Landsat 4 or 5’s Thematic Mapper. If it says "ETM+" it refers to Landsat 7’s Enhanced Thematic Mapper Plus.
Note that Landsat 7 had a malfunction in mid-2003 that created data gaps in the imagery. The malfunction was in the Scan Line Corrector (SLC). So whenever you see ETM+ SLC-off there will be data gaps in that scene, appearing as striping on both sides.
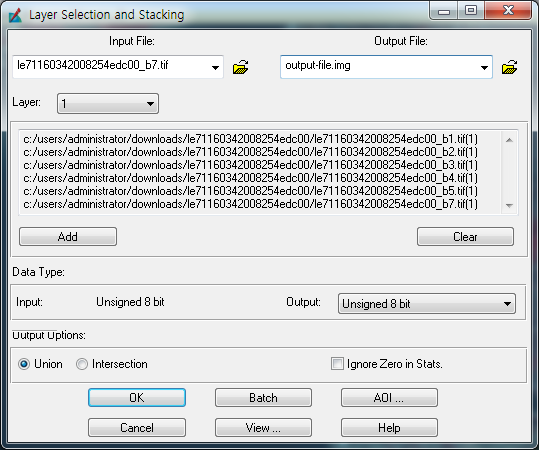
Each .tif file represents a different Landsat
band (called layers in IMAGINE). You will need to separately import all seven .tifs corresponding to
your image into IMAGINE, and then combine them to
form a single stacked image. Only bands 1-5 and 7
(the visible and infrared bands) become part of the final stacked image, but import band 6 (the thermal
band) and band 8 (the panchromatic band) into IMAGINE .img format as well.
or
Directly read 1-5,7 band .tif files and stack into a .img file as follows :